Access to this website is subject to applicable laws and regulations.
Moneta Markets is not established in or operating from Singapore and does not offer its products or services to Singapore citizens or residents. Account applications from Singapore citizens or residents will not be accepted.
If these restrictions apply to you, you should not open an account or use any products or services offered by Moneta Markets.
By continuing, you confirm that you are accessing this website on your own initiative and not as a result of any direct solicitation, invitation, or targeted marketing by Moneta Markets.
Content on this website does not serve as an offer, invitation, solicitation or promotion of any product or service in any jurisdiction where such activity is barred by law, and you remain solely obligated to ensure your access complies with all local regulations.
We wrote at the end of last month about “King Dollar” and the numerous reasons, both fundamental and technical, as to why we should see more upside. The breakout in bond yields due to rising prices and the energy crisis means the November taper by the Fed is a done deal. A more hawkish FOMC combined with persistent upside inflation risks will also push up US yields, and so the greenback.
Indeed, dollar speculative positioning has moved further into overbought territory with the highest level of net longs in nearly two years. That said, Friday’s disappointing NFP may have seen some unwinding of longs. But tighter monetary policy and the energy independence of the US only helps the buck, especially over currencies with inactive central banks still hamstrung by the “transitory” narrative.
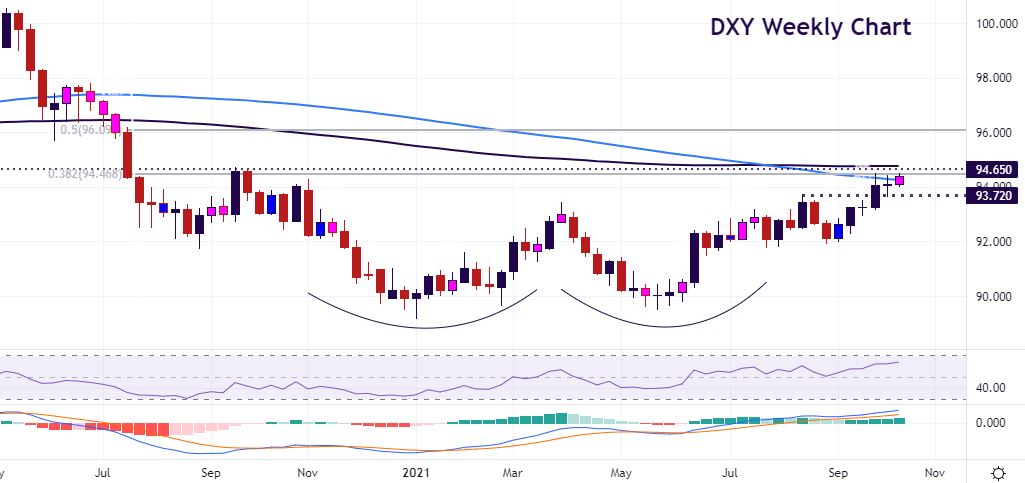
DXY Weekly Chart closing in on key zone
We highlighted the double bottom reversal pattern previously. The longer-term chart shows this well, with a target above 95. After breaking and holding above the August top a few weeks ago at 93.72, the bulls have moved through the 100-week moving average and look to be pushing higher again.
There are still a number of levels just above which are worth noting. The 38.2% Fib level of the March 2020 to January 2021 decline sits at 94.47. The recent cycle high resides at 94.50. And above here is the September 2020 high at 94.74, just ahead of the 200-week SMA at 94.80.
Bullish momentum has picked up on several indicators so there is a good chance of breaking through this zone. The next major long-term level is the 50% retracement level at 96.09.
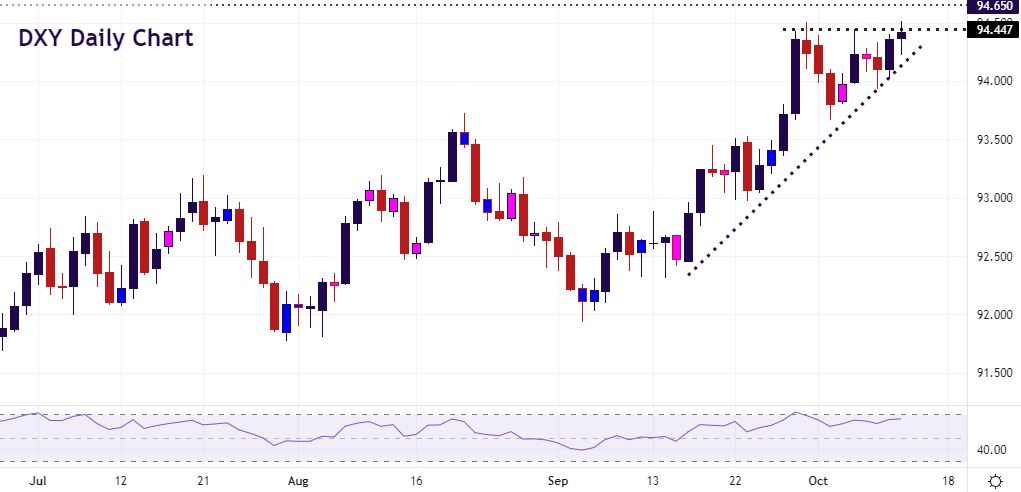
DXY Daily Chart shows a bullish continuation pattern
We can see that a bullish ascending triangle has formed on the daily DXY chart. This is a continuation pattern in an uptrend similar to a wedge or pennant. The lower trendline is drawn to touch the base of the rising lows. The three highs have formed at the top line and buyers may take a few turns to establish new ground.