Access to this website is subject to applicable laws and regulations.
Moneta Markets is not established in or operating from Singapore and does not offer its products or services to Singapore citizens or residents. Account applications from Singapore citizens or residents will not be accepted.
If these restrictions apply to you, you should not open an account or use any products or services offered by Moneta Markets.
By continuing, you confirm that you are accessing this website on your own initiative and not as a result of any direct solicitation, invitation, or targeted marketing by Moneta Markets.
Content on this website does not serve as an offer, invitation, solicitation or promotion of any product or service in any jurisdiction where such activity is barred by law, and you remain solely obligated to ensure your access complies with all local regulations.
It has been a tale of two-week for the Swiss franc. USD/CHF fell about 200-pip since July 14 and looks further weakness. The currency appreciated to nearly 0.9600 against the US dollar. Global recessionary fears and a less hawkish Fed attributed to the strength of the Swiss Franc.
Further, the Swiss National Bank (SNB) is expected to raise interest rates by 50 or 75 basis points in its next monetary policy due in September. Earlier, the SNB surprised the market by unexpectedly its key policy rate by 50bps in June, its first rate hike since 2007. The central bank kept the interest rate at a record low of -0.75% since 2015. Investors remain invested in the safe-haven currency in times of uncertainty and volatility.
It seems the market already discounted Fed’s rate hike, due to be announced Wednesday following a two-day meeting.
In addition to that, the Swiss Franc crossed the parity against the EURO to trade at a seven-year high.
The US dollar index (DXY) remains depressed below 107.00, as investors geared up for the key Fed policy meeting.
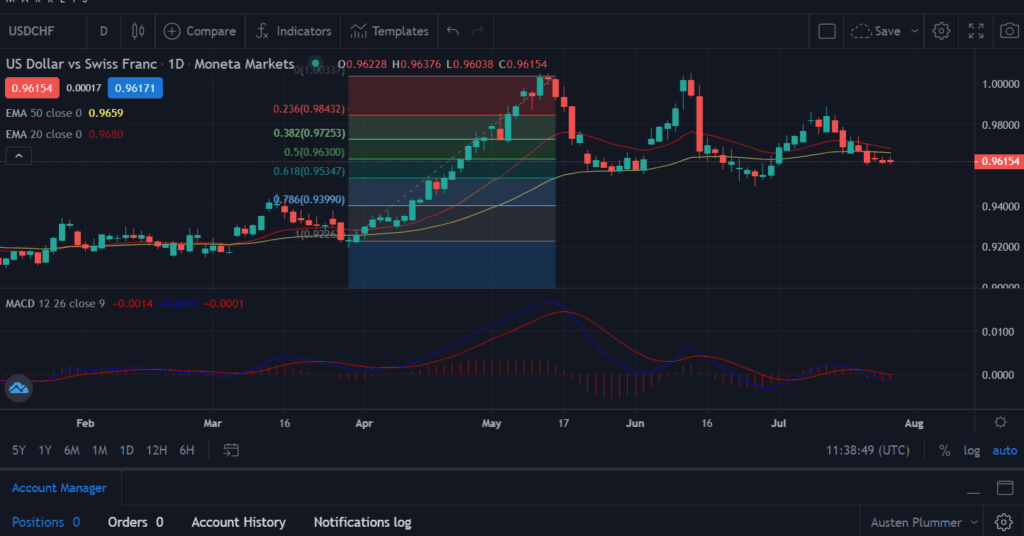
USD/CHF holds support near the 0.50% Fibbonacci retracement level
On the daily chart, the USD/CHF pair remains pressured below the 20-day and 50-day EMA’s crossover near 0.9610. This also coincides with the 0.50% Fibonacci retracement level.
A crucial level to trade, the formation of multiple Doji candlesticks suggests indecision among traders.
The moving average convergence divergence (MACD) is on the way to breaching the midline with a bearish crossover.
A daily close below 0.9600 would entice further selling opportunities in the spot. On moving lower, the price could approach the 0.61% Fibonacci retracement level at 0.9534.
On the other hand, if the buying emerges near the support zone of 0.9600-0.9610, an immediate upside target is 0.9690 followed by 0.9785.